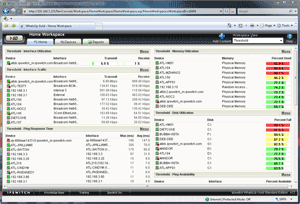
I started to learn a bit more about network monitoring tools and how to monitor the network. One of these tools is “Whats UpGold”, which can monitor uptime on devices, probe for interface bandwidth utilization and various other items. I have just begun using this software to monitor 300+ cisco devices for uptime, bandwidth utilisation, and recommend it highly. One thing about it I like, you can setup maps of a town/city/state with dot points and if a device goes down the dot shows red, and if its up its green, so you exactly know when/where it goes down.
See website below for more info.

Ipswitch WhatsUp Gold is the world’s leading network management software with over 70,000 networks reliably managed worldwide. Built on a scalable and extensible architecture offering automated device discovery and network mapping, real-time SNMP and WMI monitoring, and versatile alerting, notification, and reporting functionality, WhatsUp Gold delivers 360° visibility, actionable intelligence, and complete control.
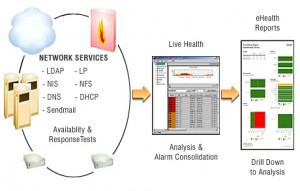
Now if you have the $$$ this other superb tool offers far more in-depth monitoring called CA eHealth, it has a deeper inspection inside the network such as utilization, latency, uptime between interfaces, and capacity planning, and other very detailed reports, compared to WhatsUp Gold.
Apparently this tool for enterprises costs around $500,000AUD to have it setup, which is why this is only used by the best of the best network operation centres to monitor large and complex networks.
For more info http://www.ca.com/us/network-performance.aspx

Help ensure the network performance and availability of LANs, WANs, routers, switches and the technologies and the network services provided over them. CA eHealth® Network Performance Manager provides comprehensive, vendor-independent technology that enables you to pinpoint areas of network performance degradation and generate real-time management reports to identify the causes of problems.
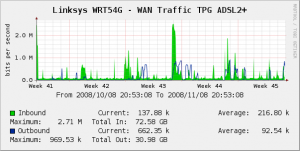
Now you are probably wondering what about some FREE monitoring tools?! I personally use CACTI which is a fantastic monitoring tool for my home network, but can be used for business/large enterprise also. The tool is open source, and has a great support forum which is excellent. The tool is a network graphing solution and many examples can be found on its website what can be monitored.

Cacti is a complete network graphing solution designed to harness the power of RRDTool‘s data storage and graphing functionality. Cacti provides a fast poller, advanced graph templating, multiple data acquisition methods, and user management features out of the box. All of this is wrapped in an intuitive, easy to use interface that makes sense for LAN-sized installations up to complex networks with hundreds of devices.
Good summary. I found when searching new NMS solutions. I have used both What’s Up Gold and CACTI and your analysis is spot on. Unfortunately never had a budget for CA products. Recently I can across PacketTrap Perspective, a new product on the market. They built more intelligence into the product that has dramatically reduced my configuration and management time. But they have some higher end features like traffic flow analysis (NetFlow, Sflow, J-Flow), performance baselining, automated remediation actions, and virtualization monitoring. You should give it a look: http://www.packettrap.com/product/index.aspx
I look forward to more of your posts.
Thanks! Nice post.
Nice post. Thanks for sharing it. Better if you can monitor website rank, position and uptime in one place!