If you wish to perform any type of graphing in MRTG/Cacti on a network device to look at the SNR, Attenuation, Downstream speed, errors, packets etc they all would be stored in a OID number.
For example I have a new router with SNMP enabled and I wish to graph the downstream SNR (Signal To Noise) margin over a set period of time into Cacti. How would I accomplish this without having any specific templates or knowledge about my router? Well there is a tool out there called “GetIf”, and what this tool does it allows you to probe your network device and it scans for all the OID values of the modem.
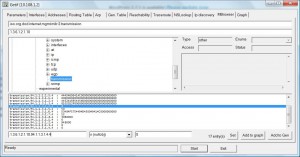
So for example in my below screenshot I have just scanned my router for values and I got a report, and then I looked through the values it found and then I tried locating the SNR value and what was matching to the modem.
In the program “GetIf” the mbrowser tab is used to scan for OID values. As in my case I have managed to find the downstream SNR OID value as .1.3.6.1.2.1.10.94.1.1.3.1.4.4, and this OID number we can then use on our cacti/mrtg template to graph this over time.
However this is not the only thing the program can do..
“GetIf is much more than an SNMP browser however, with the ability to graph OID values over time, display the device’s interface information, routing and ARP tables, as well as do basic port scans, Traceroutes, NSLookups, and IP Scans”
For more info please visit the website: http://www.wtcs.org/snmp4tpc/getif.htm
[ad#googleadd1]
