I have had the recent frustration of unable to monitor CPU/Memory on Juniper devices on WhatsUp Gold v15. If I try to add CPU it displays an error like this:

If I add the memory component to a Juniper device this works, however the memory shows always 100% in use, which it doesnt monitor it properly and looks like this:
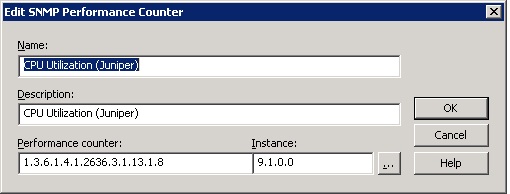
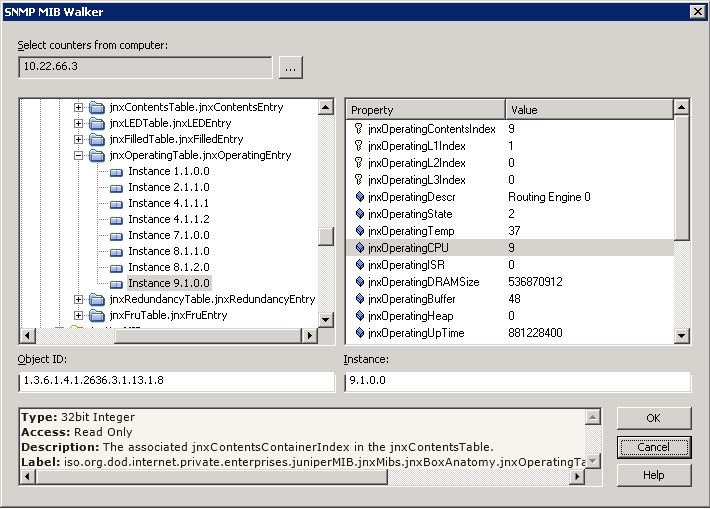
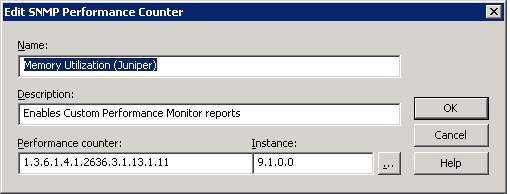
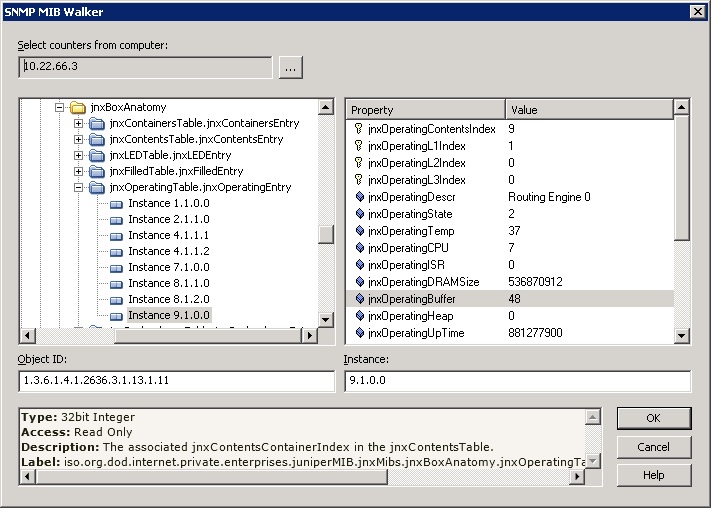
In order to rectify this I had to create custom SNMP Performance counters like these. This was to monitor CPU/Memory on Juniper EX2200 switches however it should work on other range of Juniper devices.
Adding the CPU monitoring:(Configure > Performance Monitor Library in Network Explorer)
Adding Memory Monitoring:
(Configure > Performance Monitor Library in Network Explorer)
The OID’s Used were
CPU: 1.3.6.1.4.1.2636.3.1.13.1.8, Instance: 9.1.0.0
Memory: 1.3.6.1.4.1.2636.3.1.13.1.11, Instance: 9.1.0.0
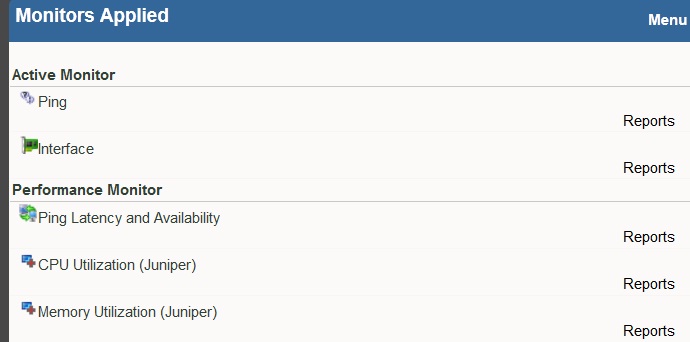
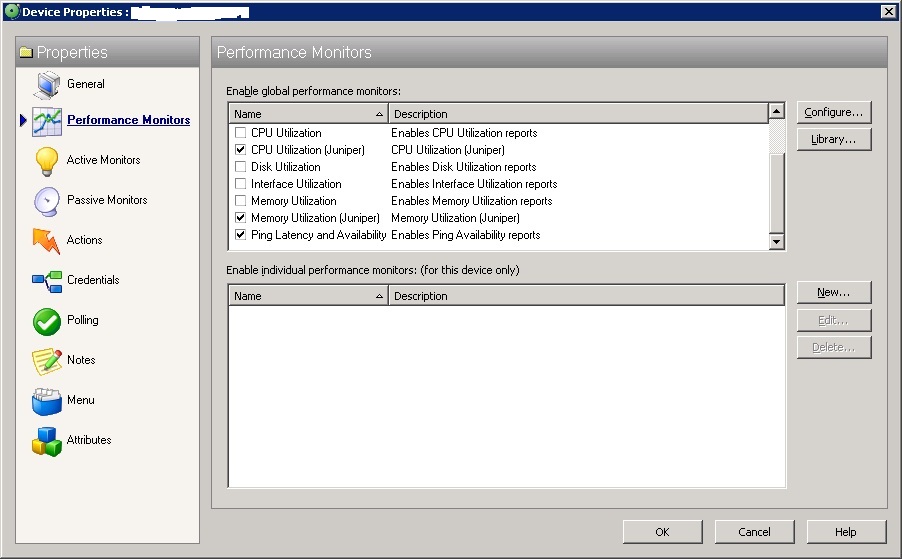
Then when I configure a Juniper Device, in WhatsUpGold Network Explorer interface I really want to make sure that “Memory Utilization (Juniper)” and “CPU Utilization (Juniper)” is ticked and the defaults unticked as they will not work since they mostly work with Cisco devices. Example below:
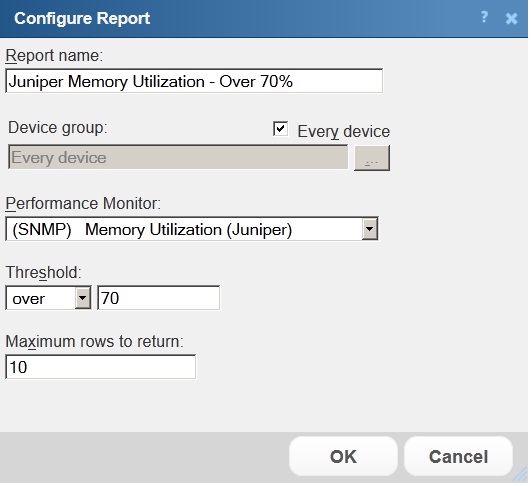
If I go back to my dashboard on the WhatsUp Gold web interface I can select “Add Content +” > Custom Performance Monitors > Top 10 By Specific Monitor or by Threshold. I like to choose the “threshold report” and set it to 70% and only if a device goes over 70% Memory or CPU it will report it on the dashboard for my Juniper Device . As in the image below:
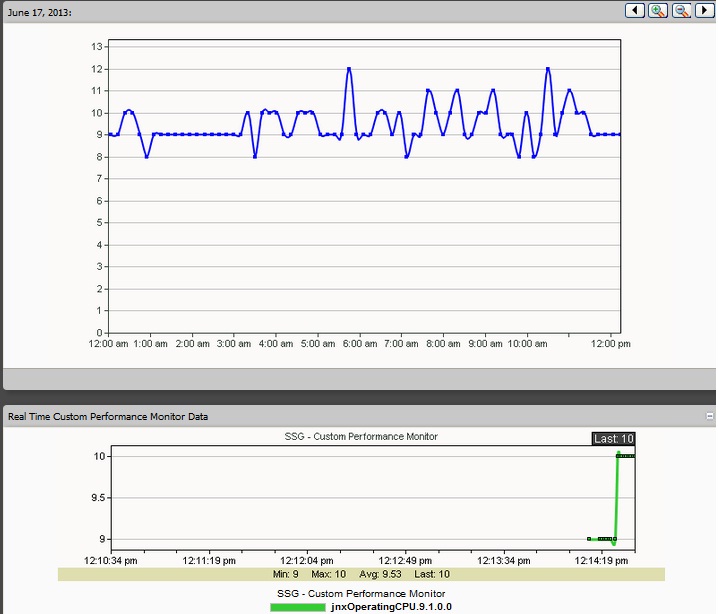
Then when I click on my device in the WhatsUp Gold web interface I am able to see statistics from my OIDs Under the “General Tab” and then clicking on “Reports”
And Voila..here we see the CPU Utilization..
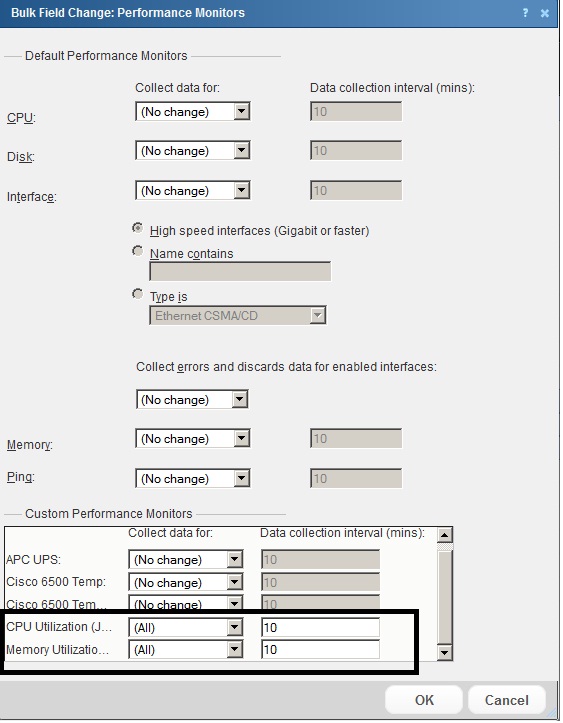
BUT what if i had 200 Juniper devices and I wanted to apply Custom Performance Monitors to all of them? It is simply not possible through the “Network Explorer” Interface running the executable on the server. For this we have to apply the custom monitor via the web based interface, and select a bunch of Juniper devices and do a “Bulk Field Change” > “Performance Monitors” by right clicking on them and then Selecting “All”
And thats what there is to it to monitor Juniper CPU/Memory in WhatsUp Gold. I hope this has been useful to some of you out there and if you have any issues please leave a comment, or any other tips!
Leave a Comment
